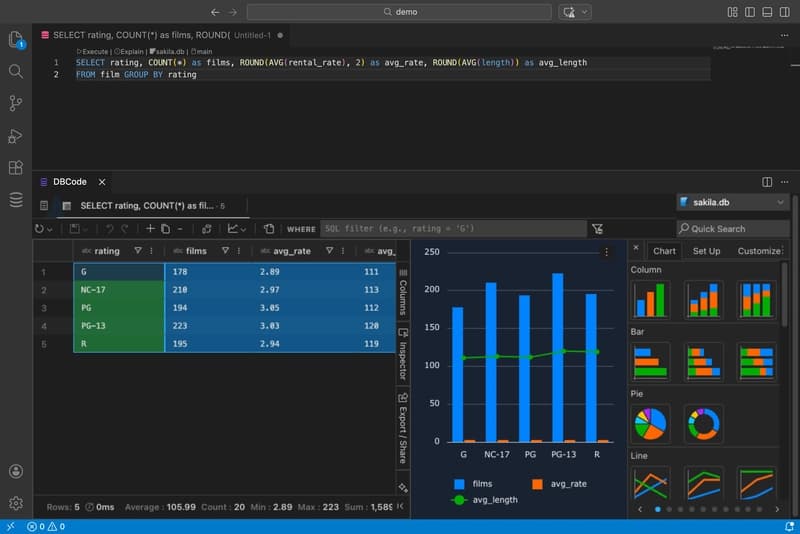
You run a query. You get rows. Now you need a chart for a standup or a Slack thread. Usually that means exporting to a spreadsheet. DBCode skips that step. Run a query, chart the results, all in VS Code. Run your query. Click the Chart icon in the results toolbar (or press Ctrl+G / Cmd+G). A chart a
⚡
Key Insights
10 editorial insights.
AiFeed24 Team·⏱ 1 min read·Cloud & DevOps
Deep Analysis
Multi-Source Intelligence
Found this useful? Share it!
Related Stories
☁️
☁️Cloud & DevOps
This week in agent commerce: seven moves, and where atomic settlement actually sits
38 minutes ago
☁️
☁️Cloud & DevOps
How I Built CoralSec Copilot: A Unified Enterprise SOC with Coral & Next.js in 4 Days
35 minutes ago

☁️Cloud & DevOps
Anthropic Just Dropped Claude Opus 4.8: What It Means for Developers 🚀
33 minutes ago
☁️
☁️Cloud & DevOps
Creating a Robust Auto-Responder for Customer Queries Using SQLite Logging
30 minutes ago